I saw this old tweet today
Tupper's self-referential formula is a formula that visually represents itself when graphed at a specific location in the (x, y) plane. pic.twitter.com/R0L3ZjqcyP
— Fermat's Library (@fermatslibrary) December 13, 2021
The equation here is not the full picture. The "data" used to render this is contained within the coordinate k as seen in the plot. k is a 544 digit number that equals
4858450636189713423582095962494202044581400587983244549483093085061934704708809928450644769865524364849997247024915119110411605739177407856919754326571855442057210445735883681829823754139634338225199452191651284348332905131193199953502413758765239264874613394906870130562295813219481113685339535565290850023875092856892694555974281546386510730049106723058933586052544096664351265349363643957125565695936815184334857605266940161251266951421550539554519153785457525756590740540157929001765967965480064427829131488548259914721248506352686630476300
Anyway, I wanted to see if I can plot this equation using matplotlib.
\( \frac{1}{2} < \left\lfloor \text{mod} \left( \left\lfloor \frac{y}{17} \right\rfloor 2^{ -17 \left\lfloor x \right\rfloor - \text{mod} \left( \left\lfloor y \right\rfloor, 17 \right)}, 2 \right) \right\rfloor\)
discarding all the floors, we get
\( \frac{1}{2} < \text{mod} (\frac{y}{17} 2^{ -17 . x - \text{mod} ( y , 17)}, 2)\)
in python this would become
0.5 < ((y // 17) // (2 ** (17 * x + (y % 17)))) % 2
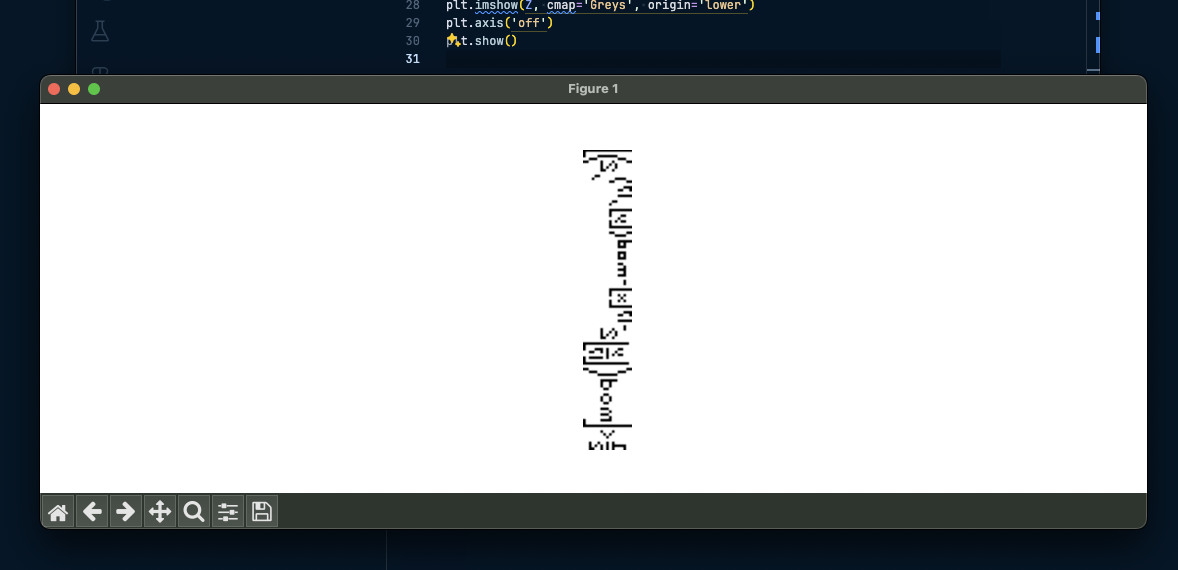
first time I tried plotting it came out flipped like so
but after reflecting and minor corrections,
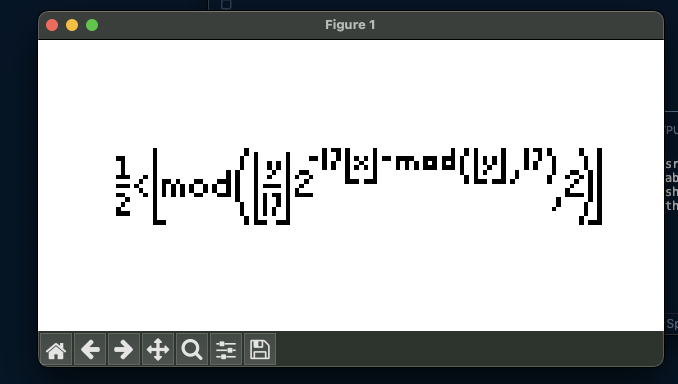
Here's the code
import numpy as np
import matplotlib.pyplot as plt

def tupper_formula(x, y):
    return 0.5 < ((y // 17) // (2 ** (17 * x + (y % 17)))) % 2

width = 106
height = 17

k = 4858450636189713423582095962494202044581400587983244549483093085061934704708809928450644769865524364849997247024915119110411605739177407856919754326571855442057210445735883681829823754139634338225199452191651284348332905131193199953502413758765239264874613394906870130562295813219481113685339535565290850023875092856892694555974281546386510730049106723058933586052544096664351265349363643957125565695936815184334857605266940161251266951421550539554519153785457525756590740540157929001765967965480064427829131488548259914721248506352686630476300

X, Y = np.meshgrid( range(k, k + height), range(width))

Z = np.zeros((width, height), dtype=bool)

for i in range(width):
    for j in range(height):
        Z[i, j] = tupper_formula(i, j + k)

plt.figure(figsize=(10, 2))
plt.imshow(Z.T, cmap='Greys', origin='lower')
plt.axis('off')
plt.show()