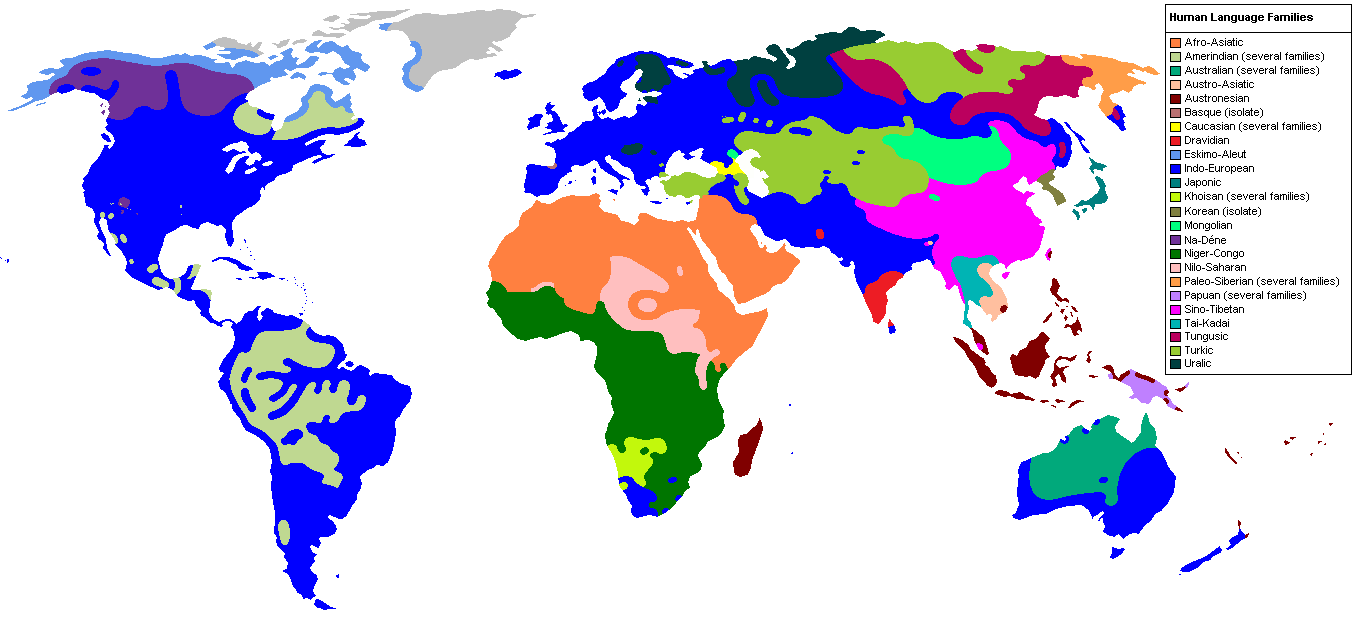
I saw this image of Language families across the globe today, and decided I wanted to do something related.
What would happen if I apply a clustering algorithm to all the Unicode characters? I wanted to this done really quickly, So no reinventing the wheel. The plans is to get the SoTA clustering algorithm and swap the dataset with the Unicode character data. Ideally, I wanted to do this with the Noto font, but I had a feeling it might get complicated (ie. Noto requires you to swap in .ttf files depending on what codepoints your glyphs are in). In the name of quick and easy Sunday afternoon project, I decided to go with unifont.
Creating Dataset
I found this official VAE MLP Clustering tutorial on MNIST dataset for the keras library. Perfect. I hacked up a python script that generates Unifont glyphs in the 28x28x65536 pixel numpy array using Pillow Image processing lib. This has the same cross sectional shape of MNIST, so it should just work.
The problem though was missing glyphs.
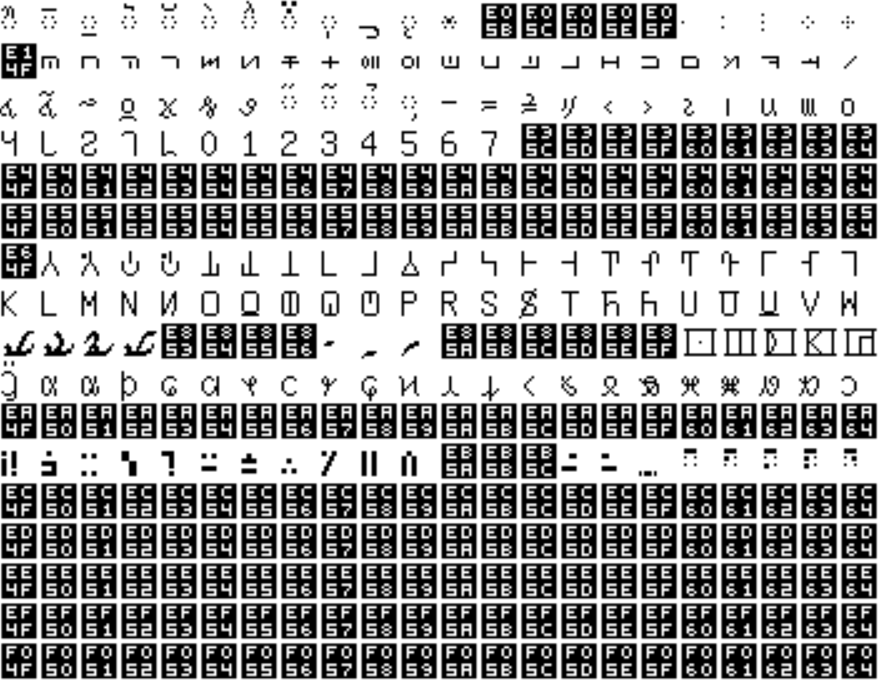
I found that a huge portion of unifont was tofu (Black squares with hexadecimal codepoint in this case). We have to de-tofu this dataset.
I could've done some cool pattern matching filtering or manually figuring out the tofu from unifont documentation, but I I decided to export each 28x28 pixel glyph image to files and delete the tofu manually.
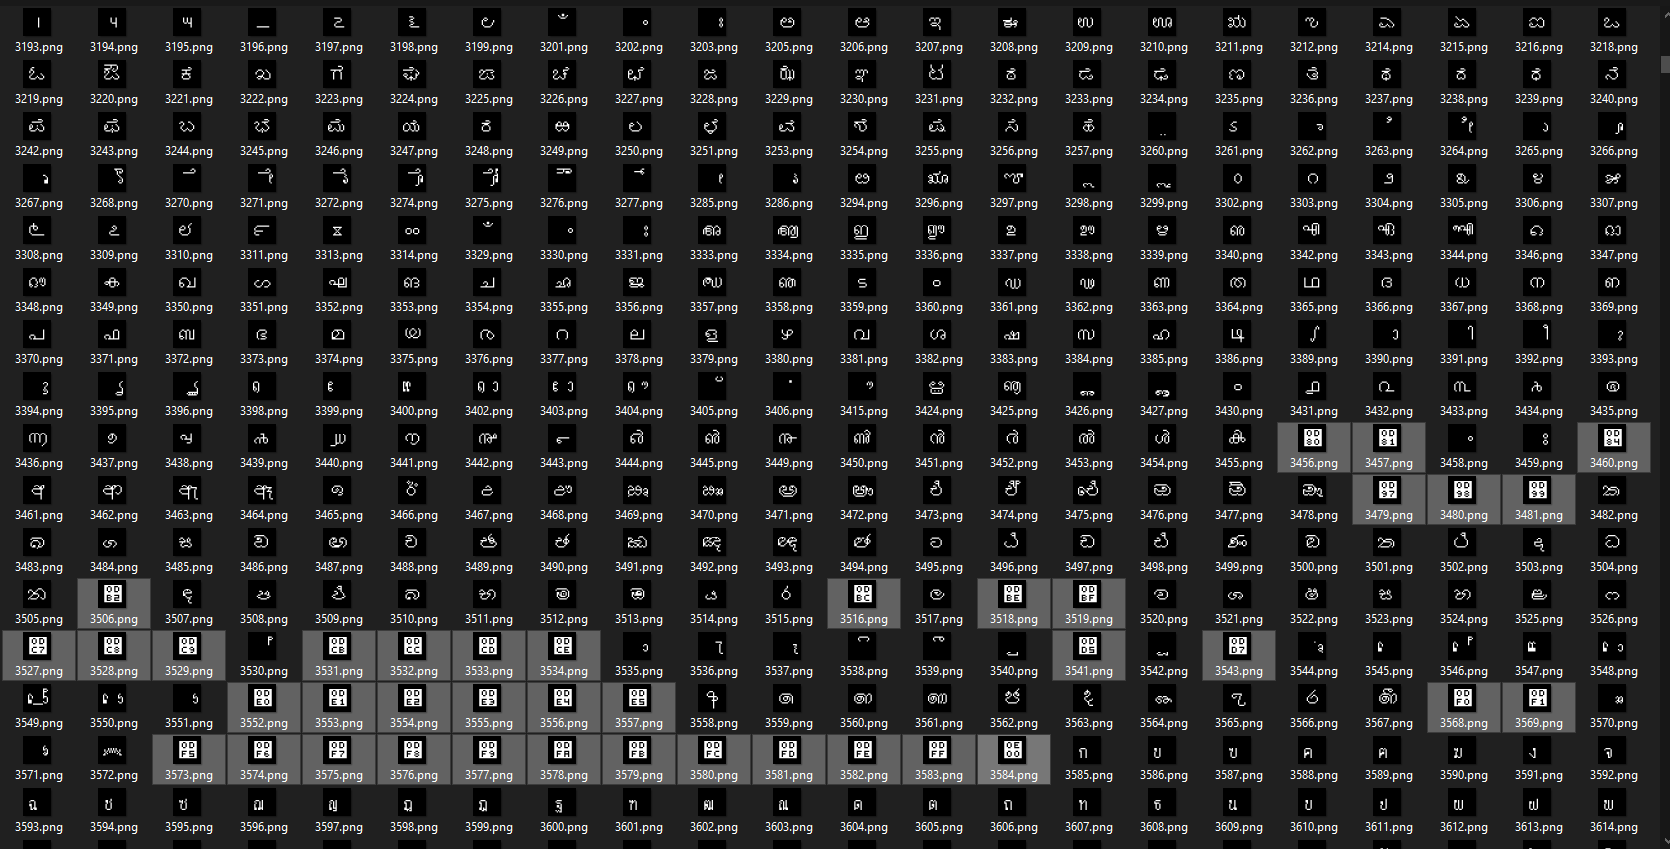
Now, I regenerated the dataset with the missing file indices removed. Also, we're only going to work with Plane0 of Unicode, so only characters from 0-65535.
Clustering
Adapting the clustering algorithm to use my dateset was easy. I did have issues trying to run this on a GPU though. CPU took only around 5 minutes. I added code to plot the values to an image file with the unifont text using PIL with coordinates from the latent space and I obtained this super high res image.
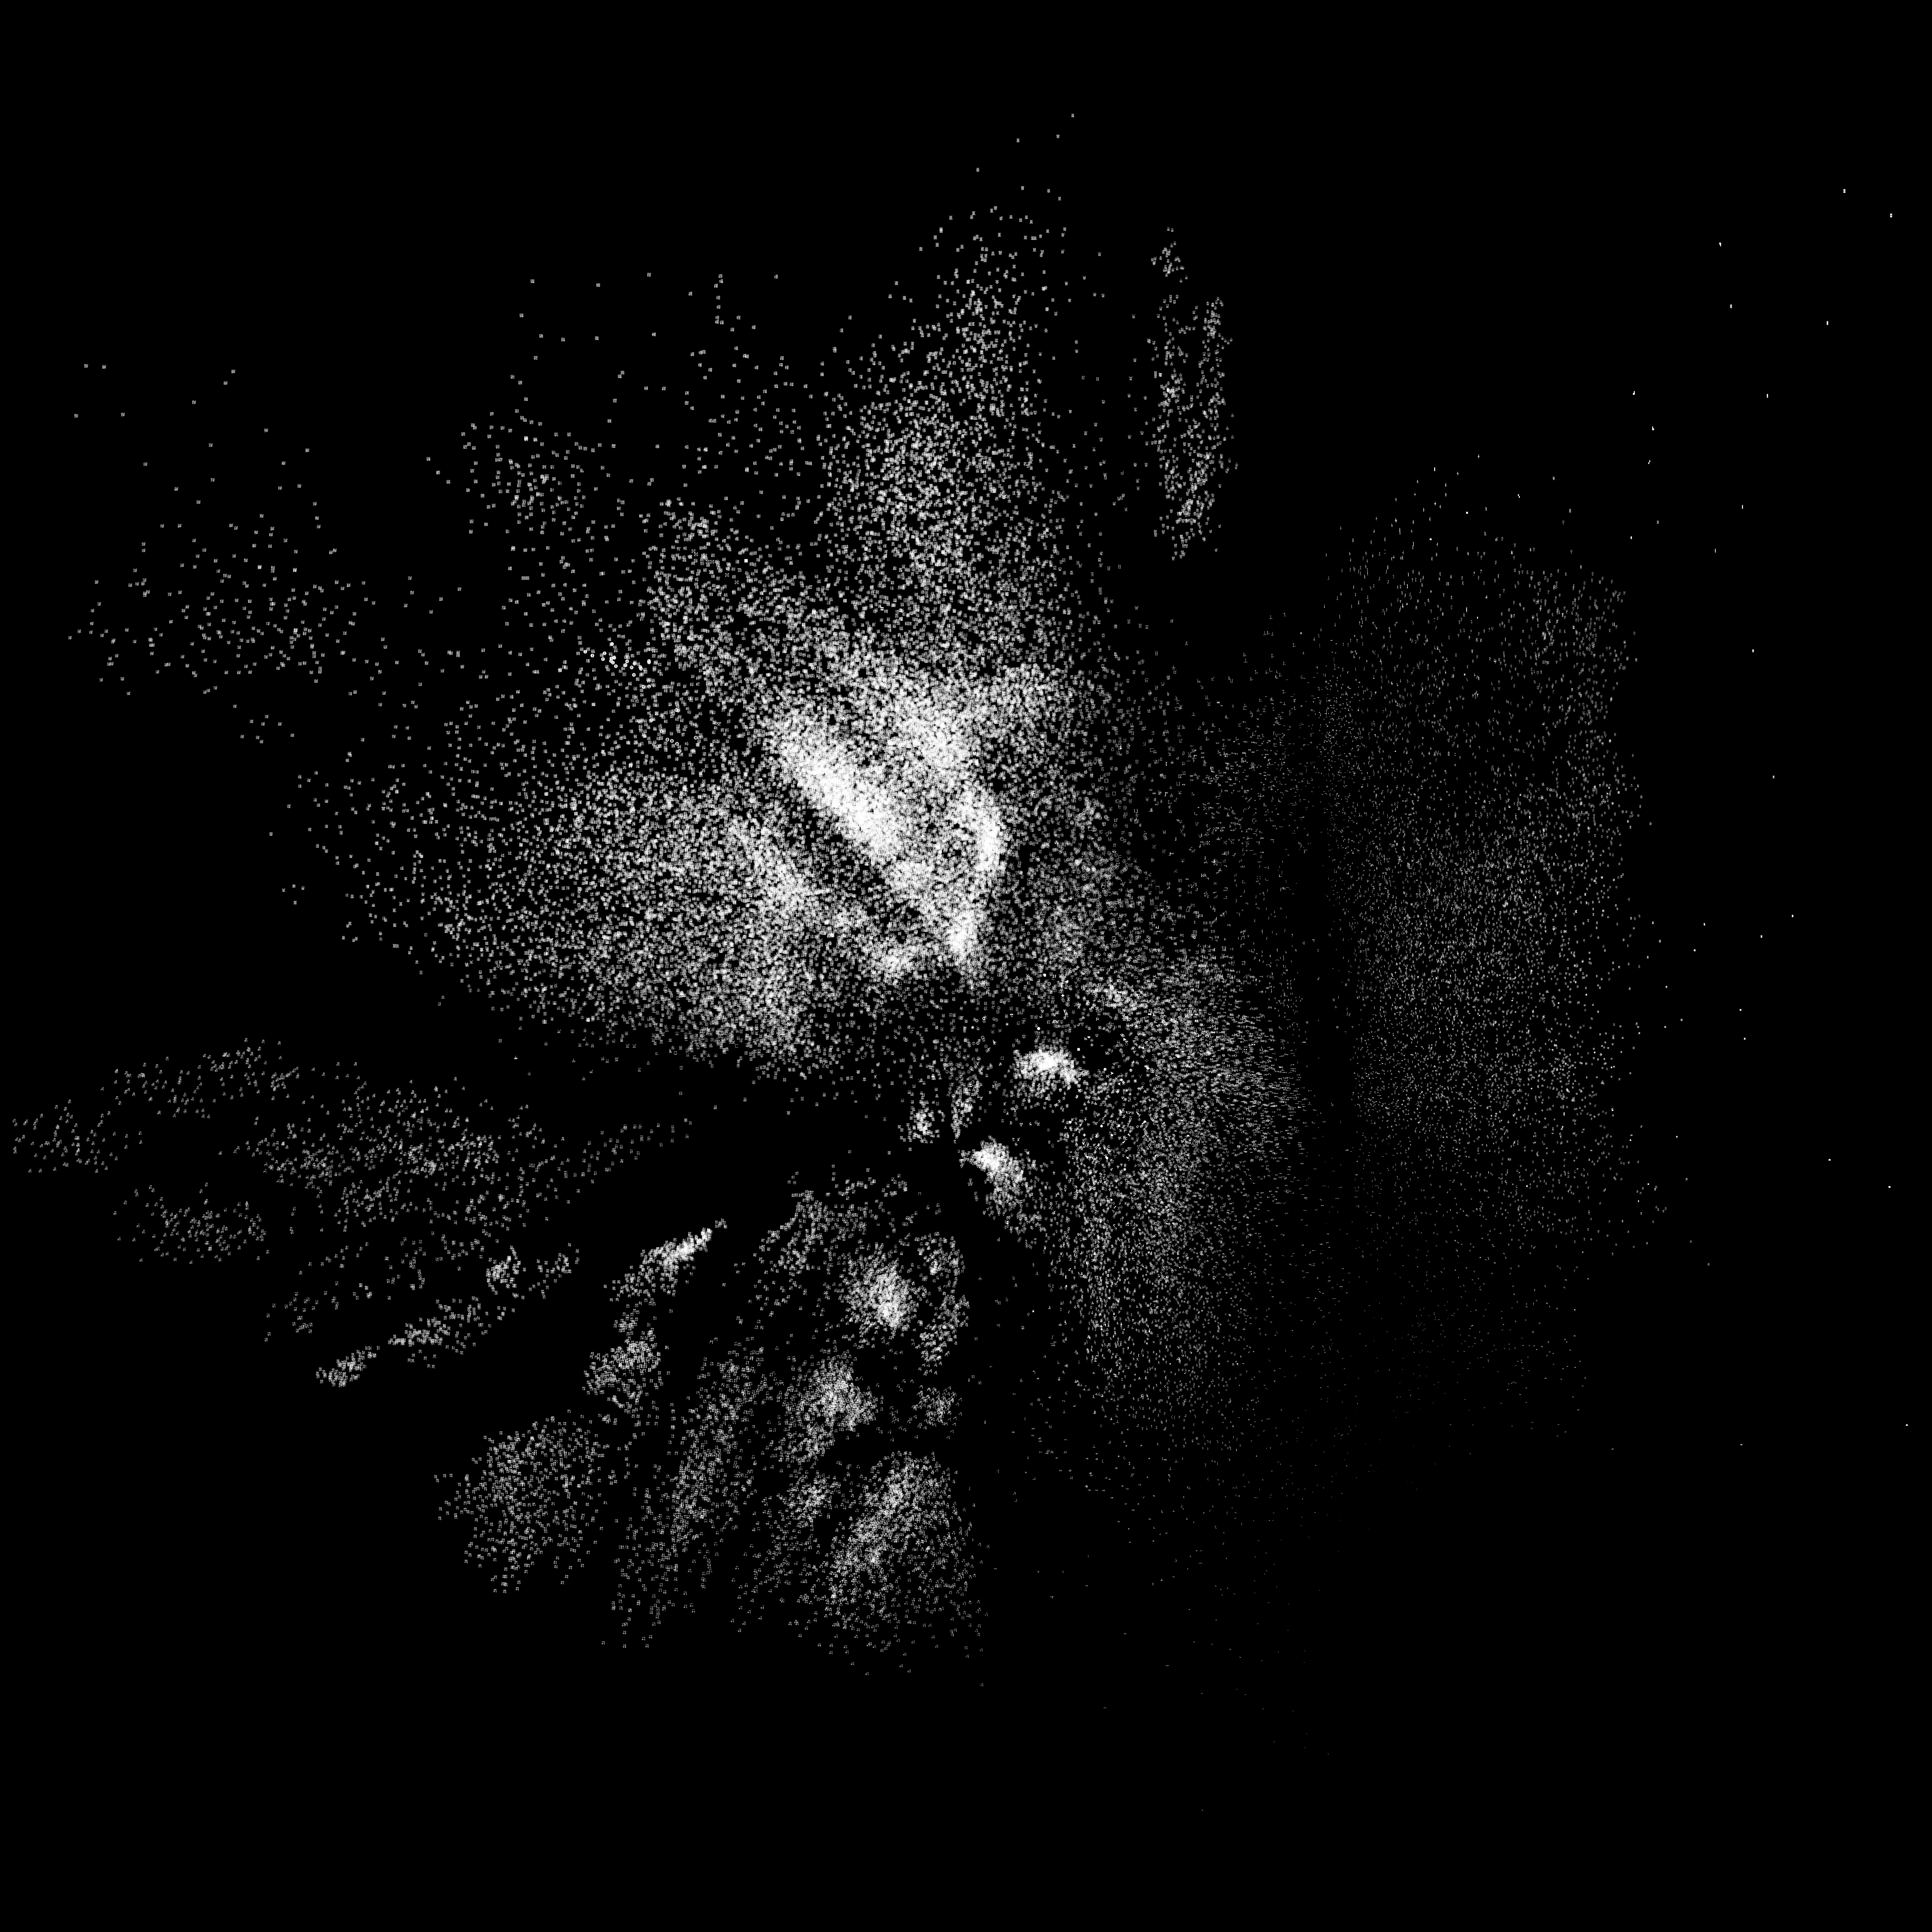
This is beautiful. As expected, The biggest cluster is CJK + Hangul characters. I decided to build a better visualizer to highlight different Unicode ranges using d3js.
Visualizing
I tried creating a visualizer based with d3-zoom, but it was struggling to keep up with the almost 50K points rendered using DOM. I looked elsewhere and found this WebGL based cluster visualization https://colineberhardt.github.io/d3fc-webgl-hathi-explorer/ . This works great. It streams the point file using Web workers and uses quad-trees for rendering, so it could easily load all the points. The only problem though was it could not render the font yet (I may work on this later). I hacked up this visualization: unicode-cluster-viz.
Mainly, we get 3 large clusters Hangul (Green patches), CJK (Yellow) and everything else (Reddish). This corresponds really well with the historical origins of all human languages. Sino-Tibetan languages evolved independently to all other human languages becasue of geographics. Hangul was developed from Sino-Korean in mid fifteenth century, but has it's distinct style.
Here are some interesting clusters..
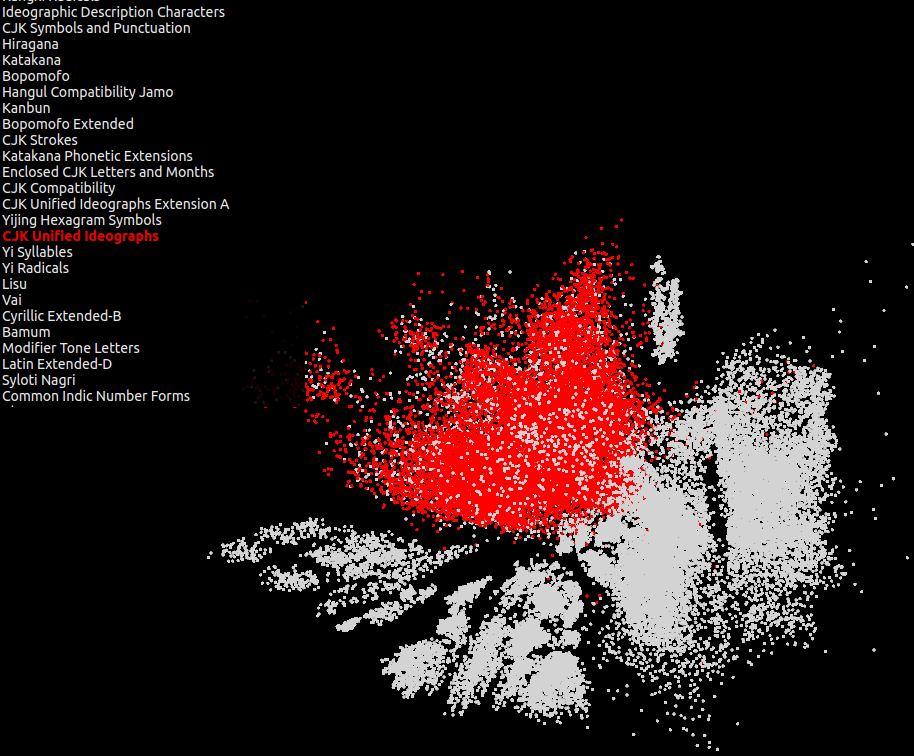
CJK
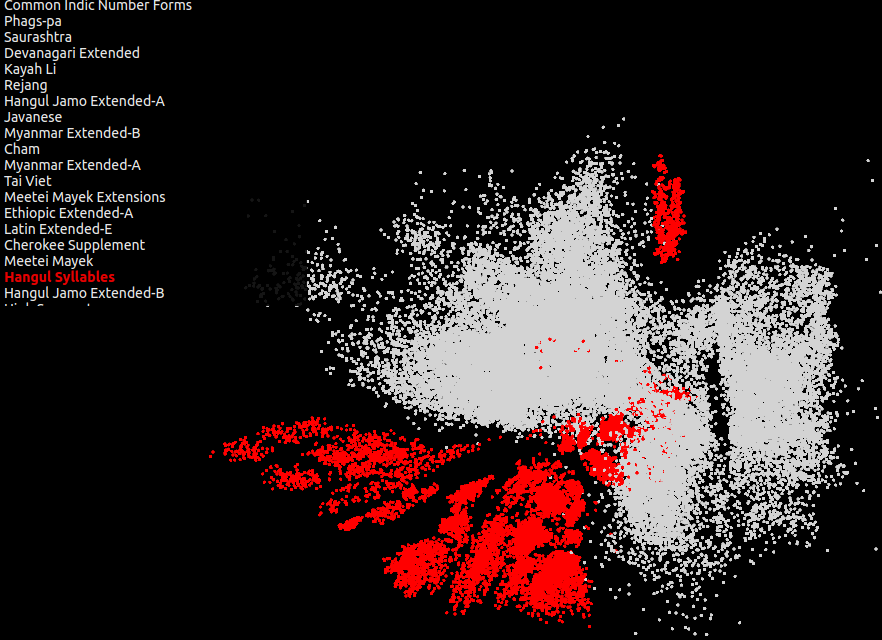
Hangul..
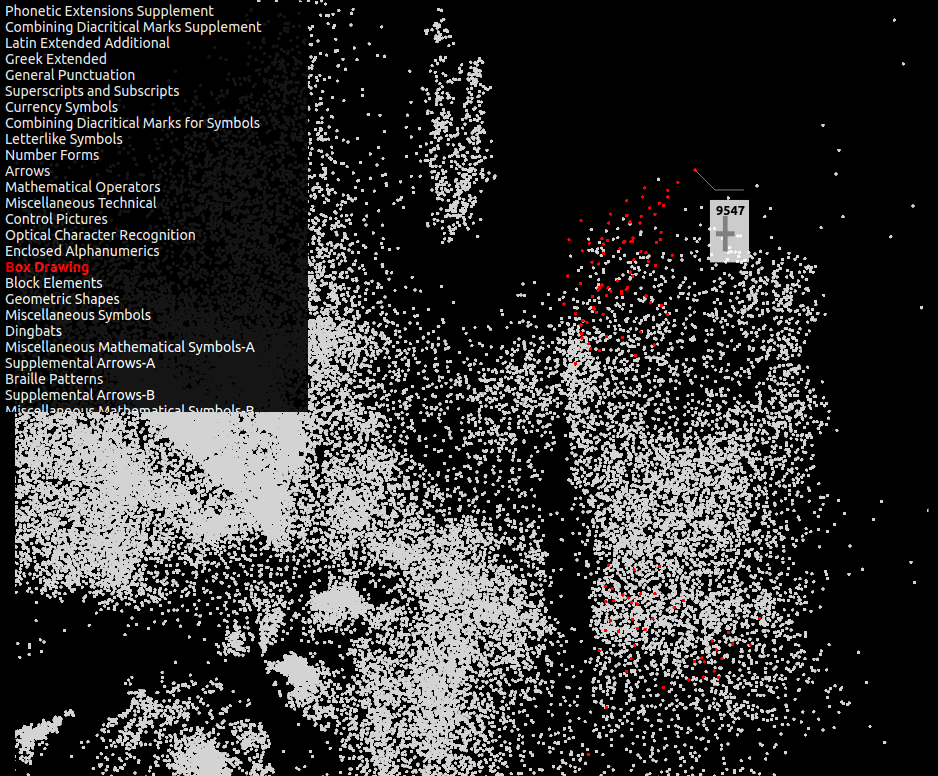
Most of the plus shaped box drawing characters (╅ ╆ ╇) are clustered and the rest of the corner pieces are below.
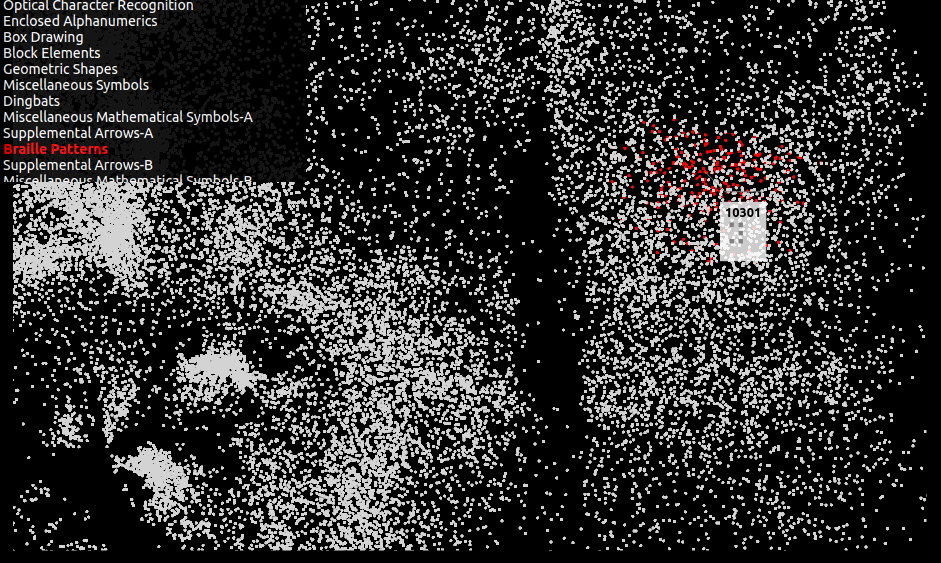
Braille Patterns (⠻ ⠼ ⠽ ⠾ ⠿) are nice and clustered as they look very very similar.
Anyway. Learned lots. I might get back to this project with better clustering and visualization.